 NimbleMap
Formats · .nc
Open a NetCDF as a map in one drop
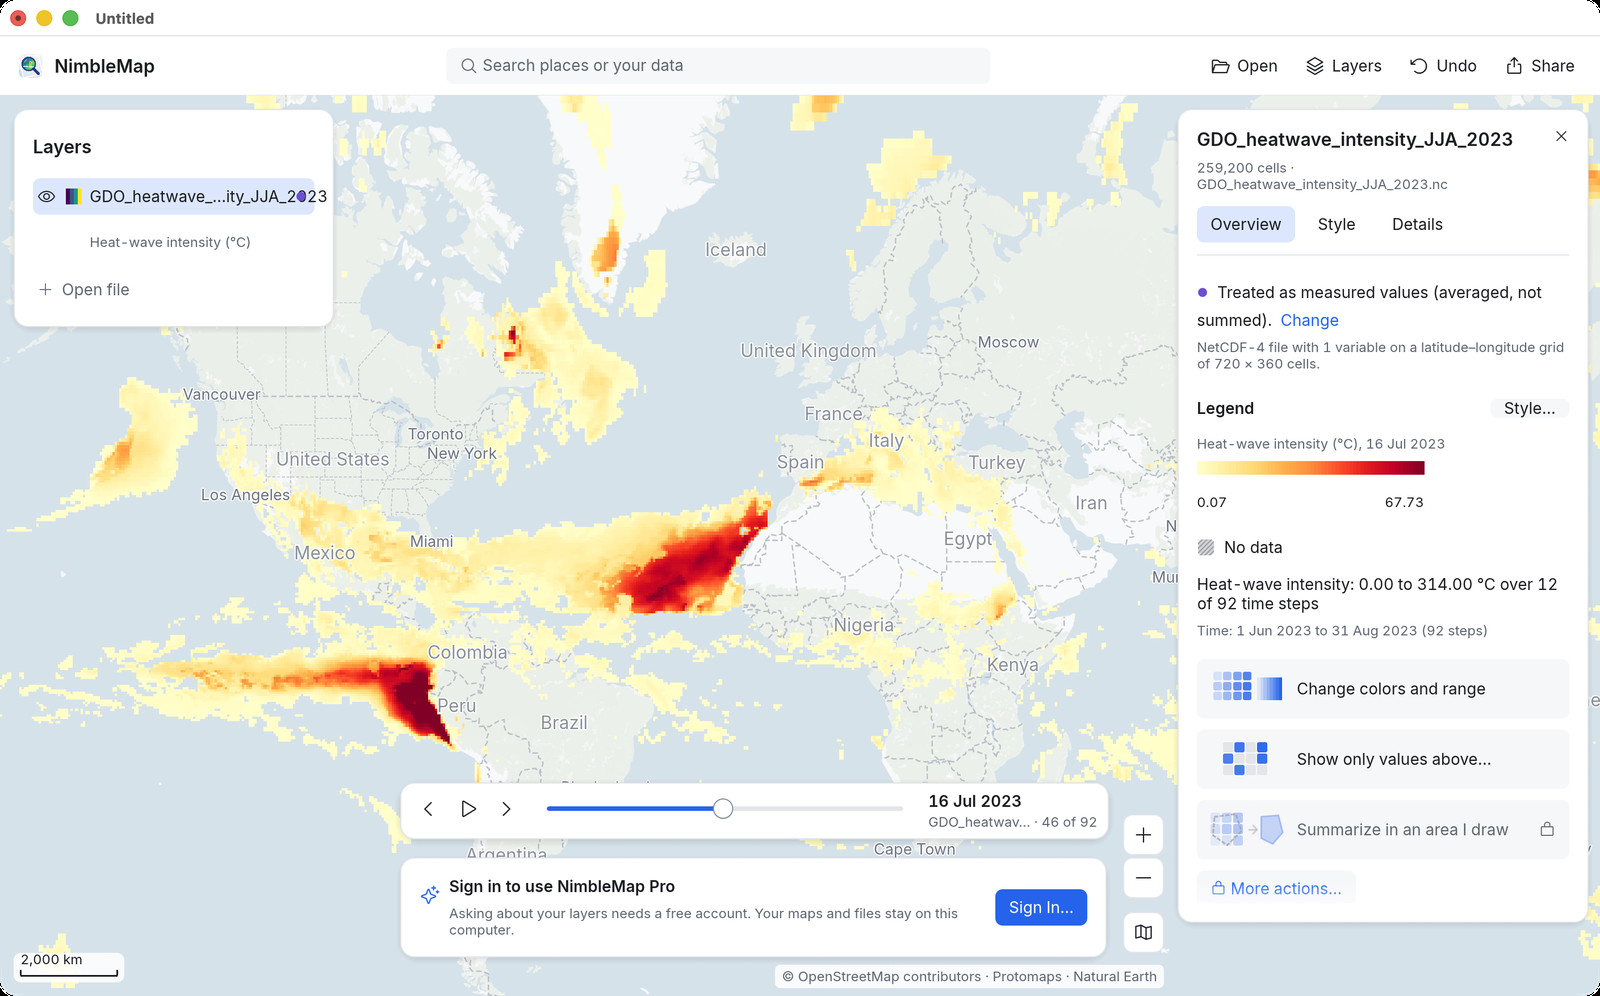
NetCDF is the usual format for climate and weather grids: temperature, rainfall, heatwave intensity, often with a time dimension. Scientists use tools such as Panoply; casual map looks need something simpler.
How
Open it in NimbleMap
Drag the .nc into NimbleMap, or double-click it. A time slider lets you step or play through the days. Click a cell for its value.
Why not Preview, a browser tab, or QGIS
When a simple map viewer is enough
Panoply is excellent for scientific inspection. Browser tools struggle with large grids and multi-layer overlays. NimbleMap aims at open climate data as a map — stack with storm tracks or city boundaries, play time, export a still — without learning a full map desk.
Questions
Common questions
Is there a NetCDF viewer for Mac that shows a map?
NimbleMap opens NetCDF grids on a map with a time slider on Mac and Windows.
How is this different from Panoply?
Panoply is the NASA science workbench. NimbleMap is for a quick map look, overlays, and sharing a picture.
Do files leave my computer?
Not in the free app. Everything is read locally.
Also see: NetCDF viewer · GeoTIFF · Shapefile · Heatwave workflow · NimbleMap vs QGIS