 NimbleMap


Earthquakes, live
USGS Earthquake Hazards Program
Free for Mac and Windows
Shapefiles, GeoPackages, NetCDF, GeoTIFFs, GPX, KML, CSVs with coordinates: the files you download from NASA, USGS or your city’s open-data portal. NimbleMap opens them as a map in seconds. No GIS training, no setup.
Available for Mac (Apple silicon, macOS 13+) and Windows 10/11 (x64). The browser version needs no install, and your files stay on your computer. Download for Windows

map data
IBTrACS_storm_tracks_1980-2026.shp: 4,999 storm tracks, coloured by top wind

NimbleMap in 72 seconds: drag in a file, explore it, ask it a question.
Hand-picked public datasets, from live earthquakes to Roman roads. Most download in one click.
.shp
Boundaries, roads, storm tracks. Keep the .dbf, .shx and .prj files beside it.
.zip
Open it as it is, no unzipping needed.
.gpkg
One tidy file that can hold many layers.
.geojson.json
The web’s map format, from open-data portals and APIs.
.csv.tsv.xlsx
CSV, TSV or Excel with latitude and longitude columns.
.kml.kmz
Placemarks, paths and areas from Google Earth.
.gpx
Runs, rides and hikes from your watch or phone.
.tif.tiff
Elevation, land cover, satellite and drone images.
.nc
Climate and weather grids, played with a time slider.
Double-click opens Shapefiles, GeoPackages and NetCDF files in NimbleMap. Other files open in other apps when double-clicked, so drag them into NimbleMap, or right-click › Open With › NimbleMap.
Looking for a specific viewer? Shapefile · GeoTIFF · GeoJSON · GeoPackage · NetCDF · CSV to map.

Scroll, pinch and drag, from the whole planet down to a single coast.

Type a city to fly there, or a name to find it in your file: here, every storm called Haiyan.

See what it is and how it compares. The 2011 Tohoku earthquake was stronger than 99% of 14,537.

Files with time steps get a slider. Press Play and watch a summer of heatwaves move.
Every number comes from all your data, not just what’s on screen, and every step can be undone.
NimbleMap Pro: ask your data questions in plain words. Unlocks when you sign in inside the app, free with an account.
What Pro adds →
4,999 storm tracks since 1980. Haiyan’s 170-knot winds beat 99% of 4,547 storms.
Try it step by step → IBTrACS v04r01
1,789 city walls. Beijing’s enclosed 35.3 km², larger than 99% of them.
Try it step by step → Xue et al. 2021 · CC BY 4.0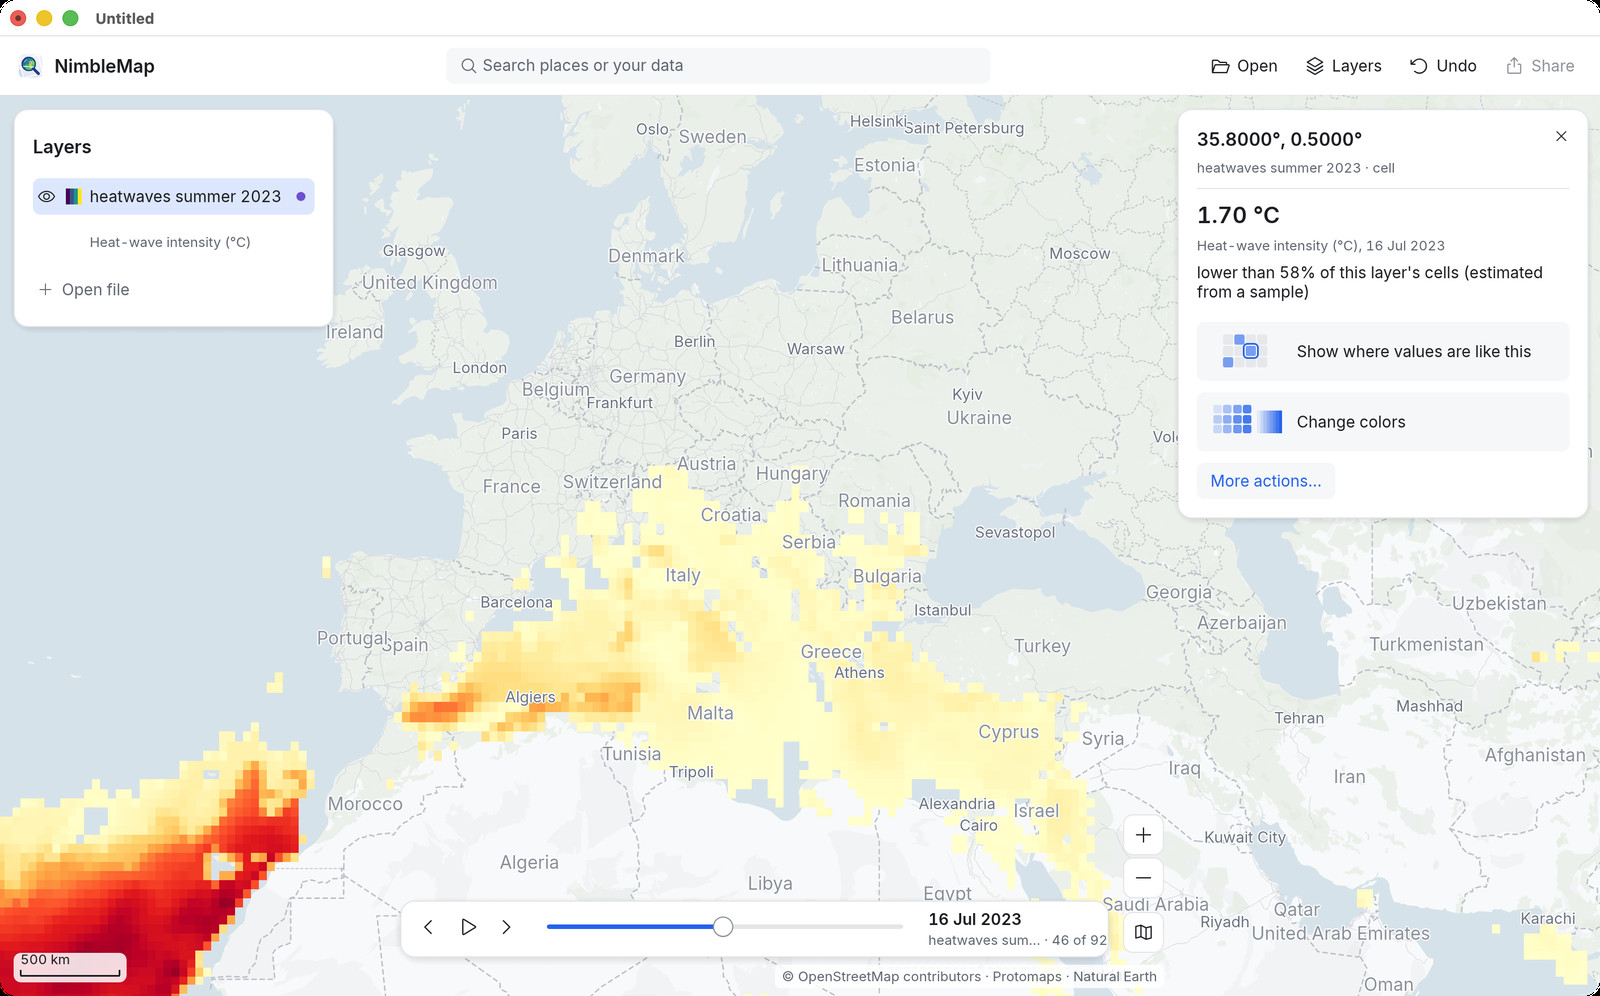
Press Play and watch the heat move across the world.
Try it step by step → Copernicus GDO / JRC · CC BY 4.0Also built in: earthquakes since 1900, volcanoes, airports, power plants, world cities, countries and elevation.
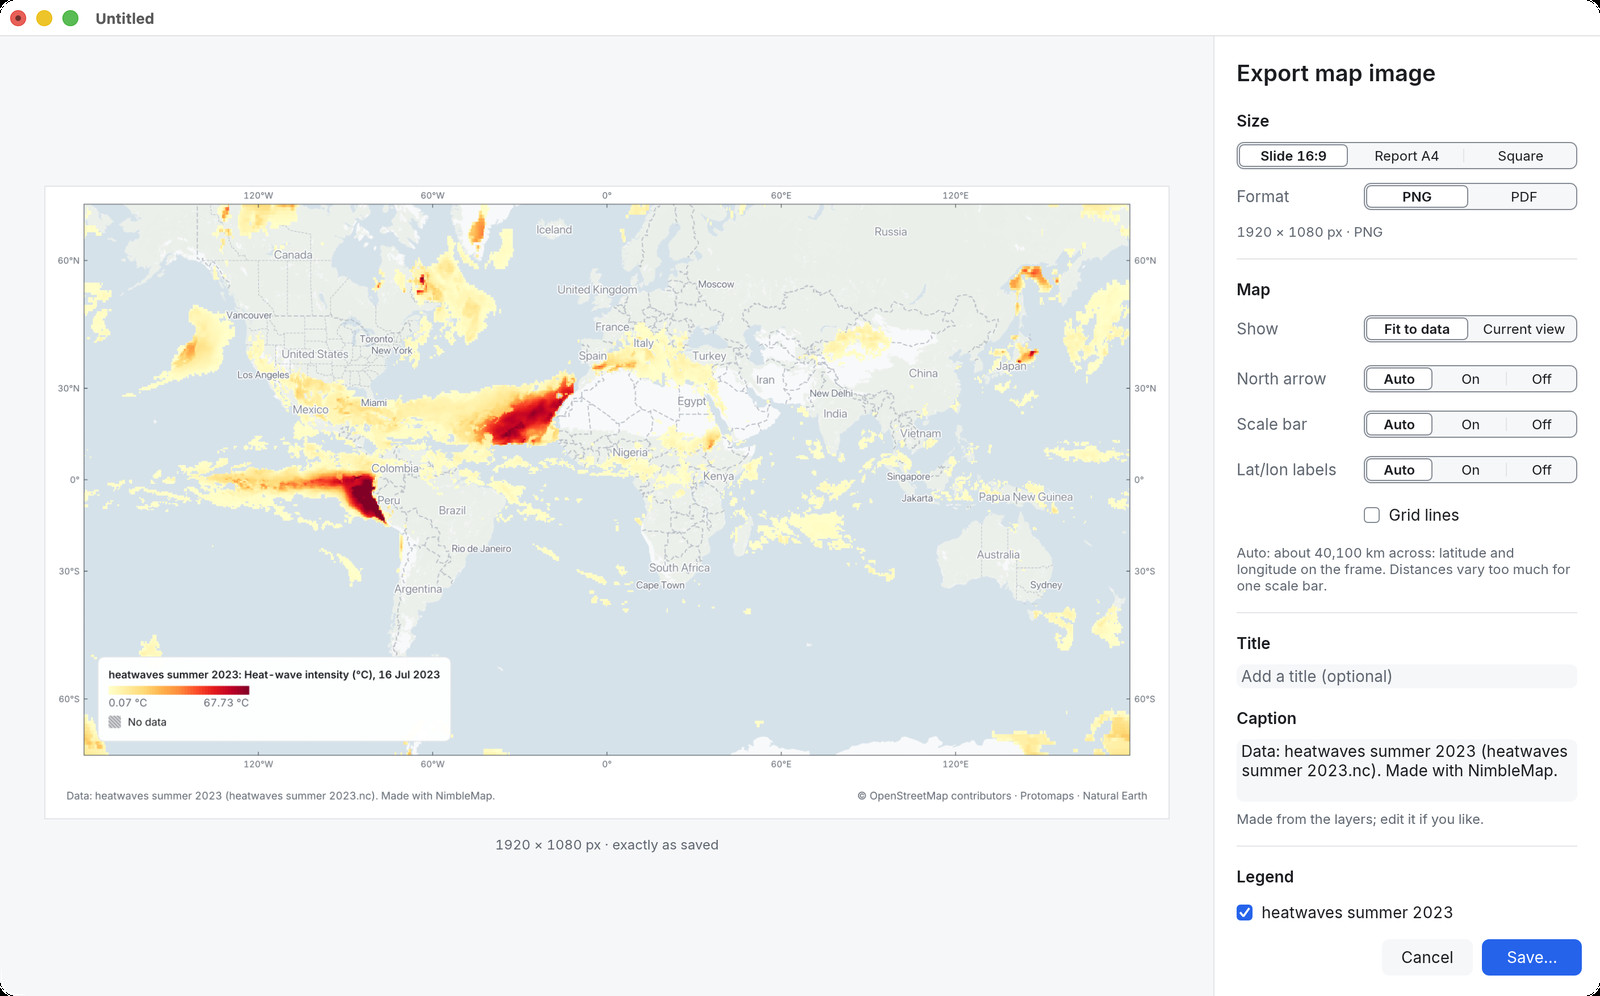
Add a title, legend and credits. Export for a slide, a report or a post.